I know very well that the perfect histogram does not exist, but knowing what to aim for can be a great help.
The histogram function on digital cameras is a picture life-saver. Before digital there was no way of seeing blown highlights or dramatically underexposed areas, but today you can quickly assess the image and its histogram and correct the exposure to get it close to perfect.
This article will not describe the perfect histogram, because there is no such thing. But it will have a go at teaching you how to read the histogram and see what different basic types of histograms mean.
What the histogram is
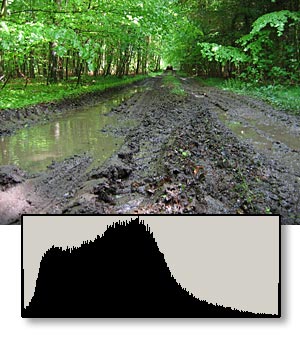
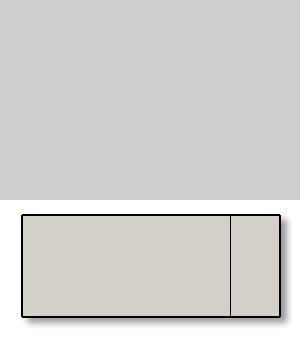
Here you see an image and below it its histogram. You have probably seen something like this quite a few times before and may understand what the graph indicates, but if you don't know what can be read from this chart, just hang on here, and I'll try to explain.
A histogram is basically a bar chart showing the amount of pixels in certain brightnesses (luminocities) or colors. The bars are arranged next to each other, and usually form a curve, which appears solidly colored below its line. What you really see is just bars very close to each other.
The bar chart is arranged in such a way that pure black is on the left and pure white is on the right. A certain level of brightness has its own little bar (a thin vertical line in the chart), and the higher that bar is, the more pixels in that brightness or color is present.
The height of the bars is calculated from the highest of all the bars. This one is set to the maximum hight, and the rest are relatively lower showing the relative precense of "their" brightness level.
Blown highlights
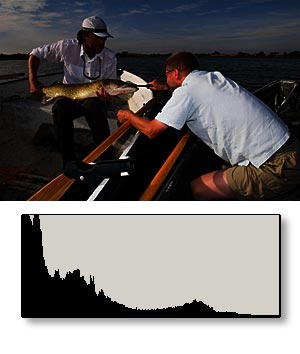
My own most important use of the histogram on the camera is ensuring that I have no blown or burned out highlights in my pictures.
Loss of details in the highlights is what I consider the biggest problem with digital images. In most cases there will be details left to salvage in the dark areas, but once the light areas go pure white (or pure any color - you can also blow one color channel at the time), there is nothing left to save.
This can be avoided by looking at the histograms.
Look at the picture to the left. It has blown highlights, which can be seen both in the histogram and in the blinking, black blotches. A fill-flash, slight underexposure and afterwork in a photo editing program to get back dark details could have saved it, and the histogram on the back of the camera would clearly tell you that you were in trouble. The histogram can also tell you about lost details in the dark, lack of contrast or too much and a few other things.
I always have the histogram enabled on my digital cameras for the same reason. A quick glance tells me whether I'm on the right track or not. Some cameras can also flash a mask over bright and dark areas of the picture, giving you even more control, but learning to read the histogram with a quick glance is a good skill to have no matter what. I also tend to prefer underexposing rather than shooting spot on for reasons explained in the article Underexpose!
As simple as they come
For the sake of understanding the basic mechanics, we will only look at brightness in this first part of this article and return to colors later on.
The simplest imagenable histogram is one of a picture consisting of one solid color. Since there is only one color in all pixels of the whole image, there is only one bar. The histogram is undeniably almost as boring as the picture, which you can clearly see below.
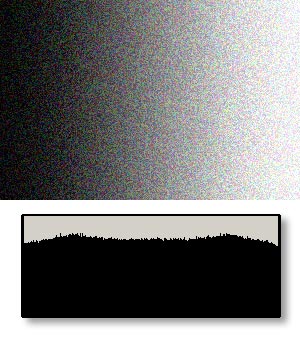
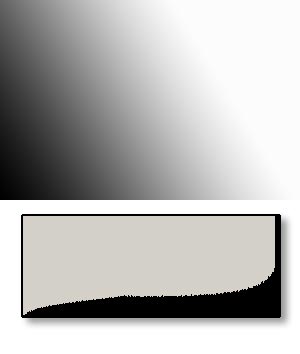
If we were looking for the second simplest histogram, it could be one of a picture that had all levels of brightness equally represented. This would have a histogram, which was basically a wall, since all levels were the same, each bar would be the same height, and since all levels would be in the picture, all bars would be there. A solid row of full height bars in other words.
Such a picture is actually not easy to make. Not even artificially. I have used a grayscale and a noise filter to create a close match, which you see below.
A couple of examples
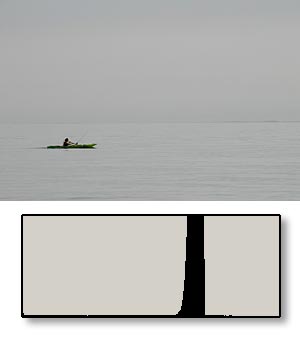
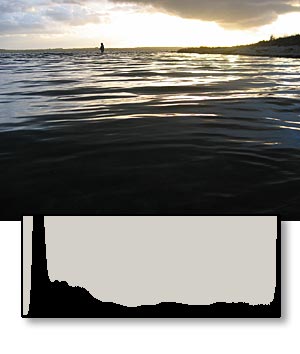
Let's look at a very easily interpreted example. Below to the left you see an image of a kayaker on the ocean. This particular picture was taken on a very hazy but sunny and calm day and shot against the sun. This light resulted in a very flat set of grey tones and a very dull looking ocean surface and sky.
If you look at the histogram below, it very clearly indicates a dull image. The extremely narrow set of high bars is the telltale of a piture with no contrast. There are almost no dark or light pixels in the picture, and even the silhouette of the kayak is too little to create a dent in the curve.
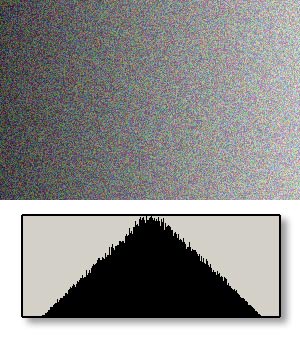
Next you see the artificial representation of a similar situation: an image with no really dark or really light areas but lots of midtones. Such an image will give you a wide or narrow single peak in the histogram as shown below the image.
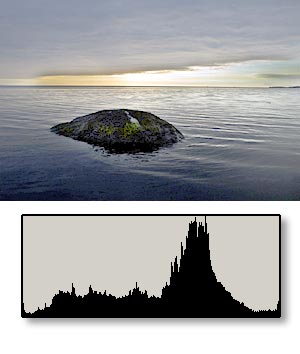
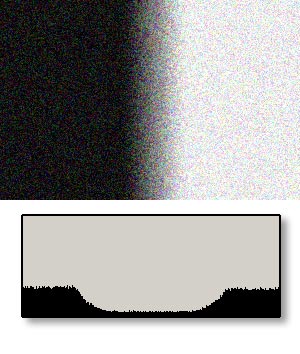
Compare the above to the example below. It shows the opposite, namely contrast. The image has been shot into a very cloudy sunset yielding a very dramatic light. At the same time the camera has been unable to capture both the darkness and the very bright parts of the sky. The result has become a very contrasty picture with few midtones.
The histogram shows this in having quite a few high bars to the left and to the right, but very low bars in the center where the midtones are.
Over and under
If parts of our image falls outside of the range that the camera can capture, they become either pitch black or bright white.
In most cases this is a problem, because these parts of the final picture will contain no details. They wll just be white or black. Since the camera has captured no details, not even the best software or photo-editor can get out any details.
Because of this fact we generally want to avoid loss of dark or bright details. The histogram can help us here.
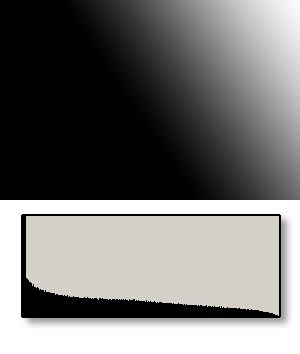
Very bright pictures will tend to move the histogram to the right on the scale while dark images will slide the histogram to the left. If we have a histogram that has nothing in the left part of the chart, but squeezes tightly to the right side, we have an over-exposed image and vice-versa.
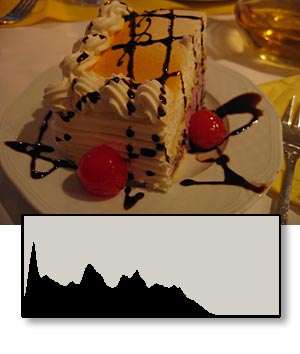
Look at the picture of the cake below. Most people will not need a histogram to tell that this image is too dark, but it shows the effect on the curves. The artificial histogram on the right shows the schematics: the bars to the left ar high and the bars to the right are low. Underexposure and lost dark details!
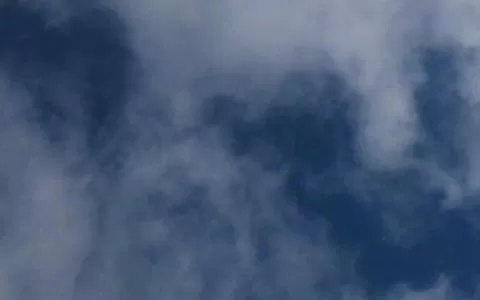
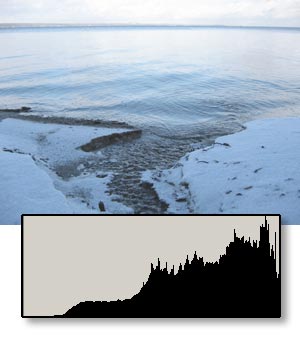
Below you can see an example of the opposite problem. While the above image was too dark and appeared brownish and greyish as it often happens indoors, this image was taken outdoors on a snowy overcast winter's day, where overexposure and blueish images are very typical. In most cases the camera will have a hard time with all that white and bright in the picture, and images like the one below are common. They come out dull, have too few dark details and are often tricked by the light to render things too blue. Snow and clouds are not a good combination, and snow pictures are best shot in bright daylight and with sun. And make sure to set your white balance.
After the picture is the schematic and artificial representation of the same situation. Lots of bright pixels, but no dark ones.
In real life
The examples above have all been chosen to illustrate a point, and most of us would be able to find the possible flaws in the different images without looking at histograms. But they serve to show you what to look for.
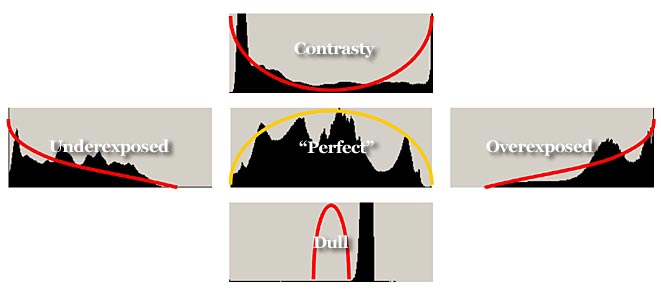
Look at the table below. Each histogram has been overlaid with a line that indicate its general shape. The middle one shown is a "perfect histogram". All tones fall within the edges and we have a fairly even distribution of tones.
Above that is a contrasty picture. This has a saddle-shaped curve, and the danger here lies in loss of both dark details and highlights.
Below you will find a dull image with little contrast. That has a narrow curve with few tones.
Histograms shifted too much to the left means dark images and danger of underexposure and loss of dark detail and curves shifted too much to the right is a warning of a light picture with possibly burnt-out highlights.
Perfect and not
As written already in the beginning of this article, there is no such thing as a "perfect" histogram. The best shape of the histogram depends very much on the content of the individual image. Some pictures come out better if you aim at an evenly distributed curve, while others are perfectly fine even though their histogram seems to defy all the basic rules mentioned here.
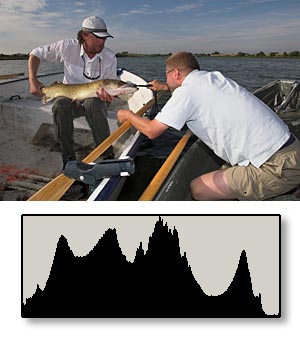
Let's finish with a couple of examples. The left image is a classical one when it comes to histograms. Its curve shows a well exposed picture (evenly distributed bars) with highly saturated tones (high levels over a wide spectre) and well controlled dark and light areas (falls off in both ends). And sure enough that is the case. A fill flash and sunlight has insured a fine and flawlessly exposed image.
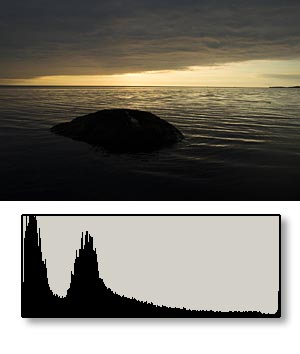
Looking at the curve for the right picture on the other hand shouts: "underexposed and much too much contrast". Had this curve been the result of the first image, that would have been absolutely right: the scene with the anglers would have been badly exposed. But the of the rock in the sunset is actually quite OK when it comes to exposure. It gives the right impression of how the sunset looked that evening on the beach, and it would not at all have worked with an evenly distributed curve.
Let me show you what happens if we try to simulate the reverse situation. Now the curve on the left image says "underexposed" and that is indeed the case, the image of the anglers is way too dark. The right histogram on the other hand says "nearly perfect!", which is not the case. This may be mathematically well exposed with an even tonal range, but it is very far from reality. Trust me, I was there! The bright, and evenly lit pictures does in no way show how it looked on the beach that evening. On the other hand it serves to illustrate how much detail and color can be pulled out of almost black parts of a dark image.